Forsta Studio Canvas

Your data, your story
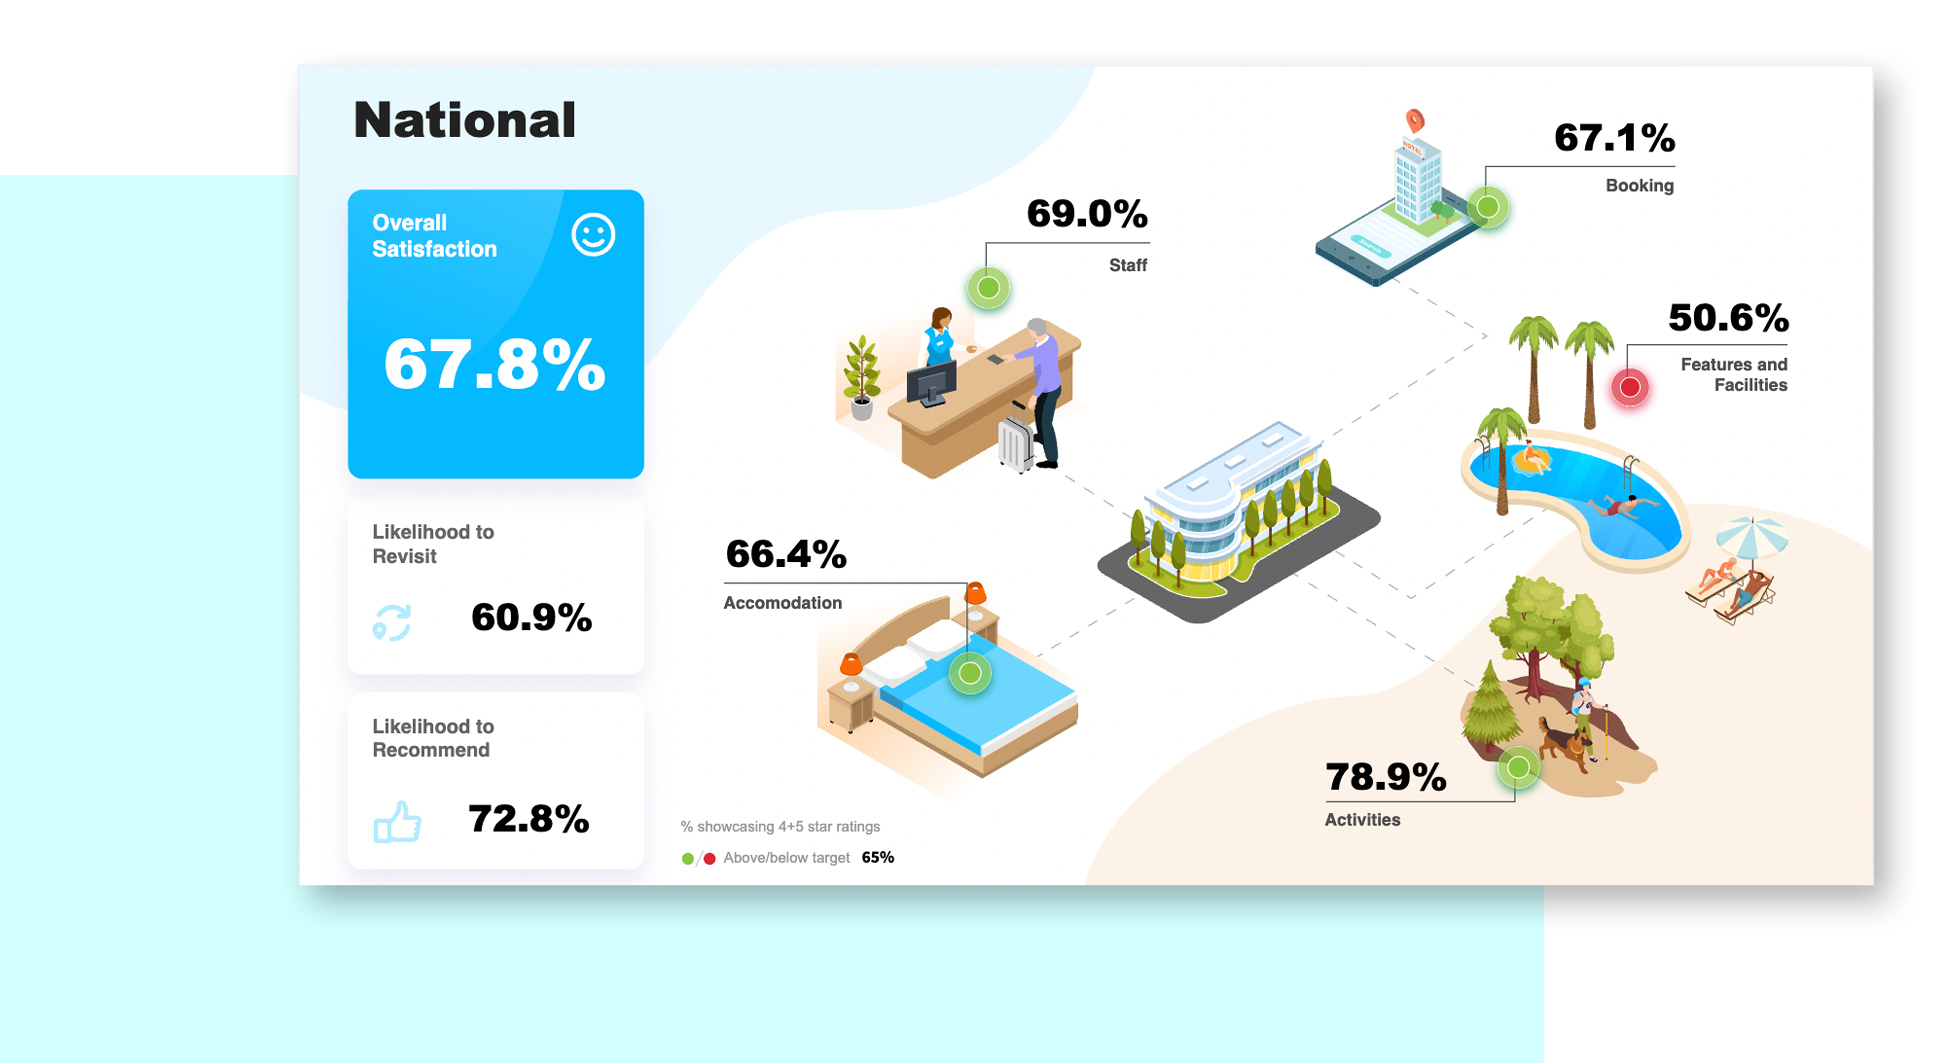
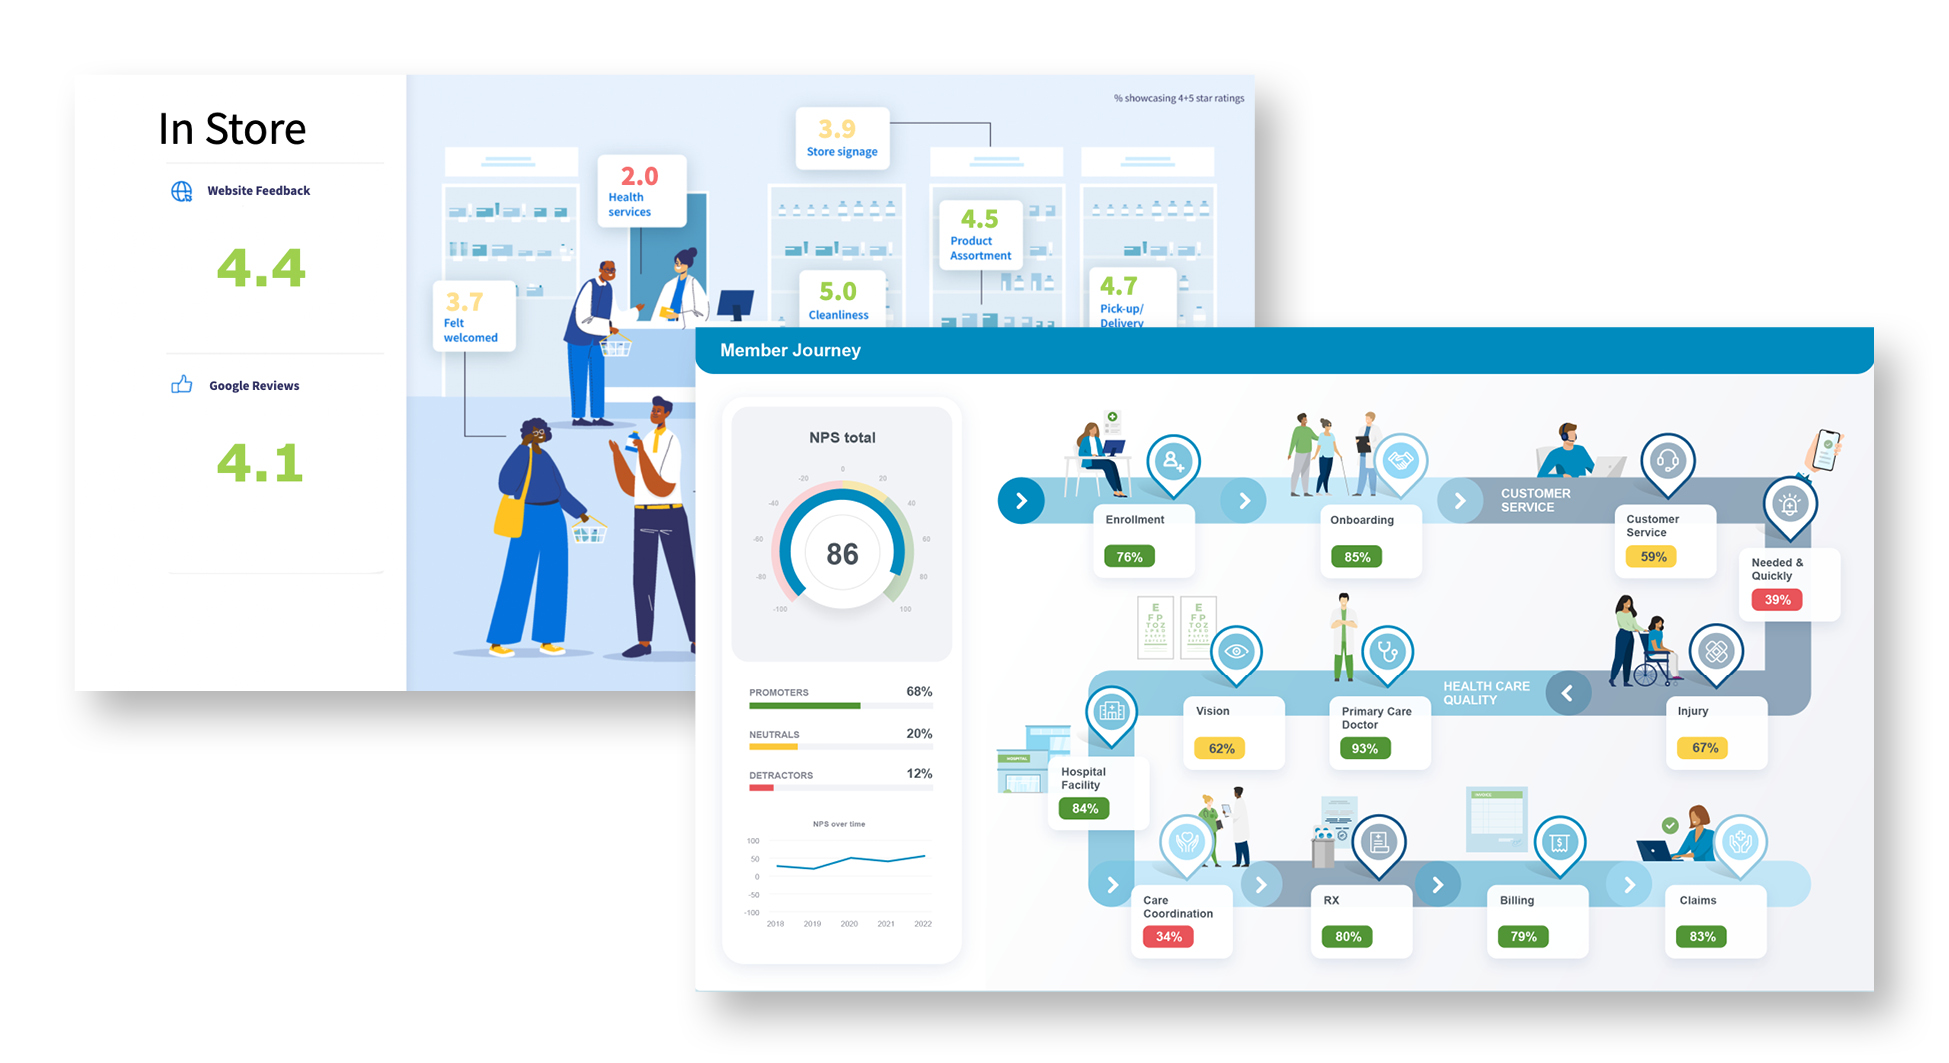
What if you could tell your data story effortlessly? Pick relevant data and emphasize key points with relatable imagery to enchant your audience.
Forsta Studio Canvas puts the pen in your hand, so you can produce perfectly configured reports, effortlessly.
Create professional-looking reports that go beyond standard bar graphs, pie charts, and data tables to suit your story.
Visual storytelling made easy
Drag and drop for the win
No tedious click-work here. Just drop in a background – an image or some colors, and slot your data into place.
Add style to your substance
Add icons, pictures, and symbols to highlight essential details.
Put your finger on the pulse
Use any item in your canvas as a clickable button to lead to a new page – keep diving deeper.
Insights on tap
All data points in the report are updated live.
Link images/icons to data values
Easily connect any item in your canvas to data values and have them change as data changes

Share stories that inspire action
Engage leaders and secure buy-in
Get your audience hooked by presenting clear, concise, and contextual stories.
Move with precision and control
Uncover the hidden depths of your data to unlock powerful insights, identify patterns, and understand your priorities.
Bring your company closer
Context is key – create canvases that speak the language of your people across departments and teams.
Make data easy and accessible
Canvas is for all. Let all stakeholders engage with data, no matter their level of technical ability.

Storytime for all
Everyone loves a good story, no matter which industry or functional department you’re in.
Departments
Customer Experience (CX)
- Customer journey mapping
- Customer feedback analysis
Supply chain
- Warehouse analytics
- Consumer demand patterns
Sales & marketing
- Lead tracking and conversion
- Buyer decision assessment
Human resources
- Employee lifecycle
- Learning & development planning
Industries
Insurances
- Claims management journey
- Underwriting process
Banking
- New customer account opening journey
- Customer digital services
Retail
- Buyer shopping journey
- Consumer demand patterns
Healthcare
- Patient experience journey map
- Revenue cycle management
Related resources
Emotions: the key to unlocking insights for results
Emotions: the key to unlocking insights for results Emotions: the key to unlocking insights for results Clarity, Connection, Conversion. Seamlessly Achieved. In the world of customer experience (CX), many programs fall short by focusing on outdated score-chasing metrics like NPS without realizing the untapped potential of emotional insights. This eBook is your guide to unlocking […]

Integration: the new frontier of insights
Integration: the new frontier of insights Integration: the new frontier of insights Efficiency, intelligence, insight. All in one. The new frontier of insights is here and it’s swifter, smarter and scalable. Market research professionals know the challenge all too well: endless hours spent preparing data and reports, leaving less time for uncovering the insights that […]

The research agency’s AI efficiency playbook
The research agency’s AI efficiency playbook The research agency’s AI efficiency playbook The rise of AI has led to a surge of excitement, anxiety, and confusion within the research industry. Agency leaders can reap the rewards of this new landscape with our five guiding principles for integrating AI into your strategies. From boosting operational efficiency […]

Learn more about our industry leading platform
FORSTA NEWSLETTER
Get industry insights that matter,
delivered direct to your inbox
We collect this information to send you free content, offers, and product updates. Visit our recently updated privacy policy for details on how we protect and manage your submitted data.