An introduction to dynamic questions

What are dynamic questions?
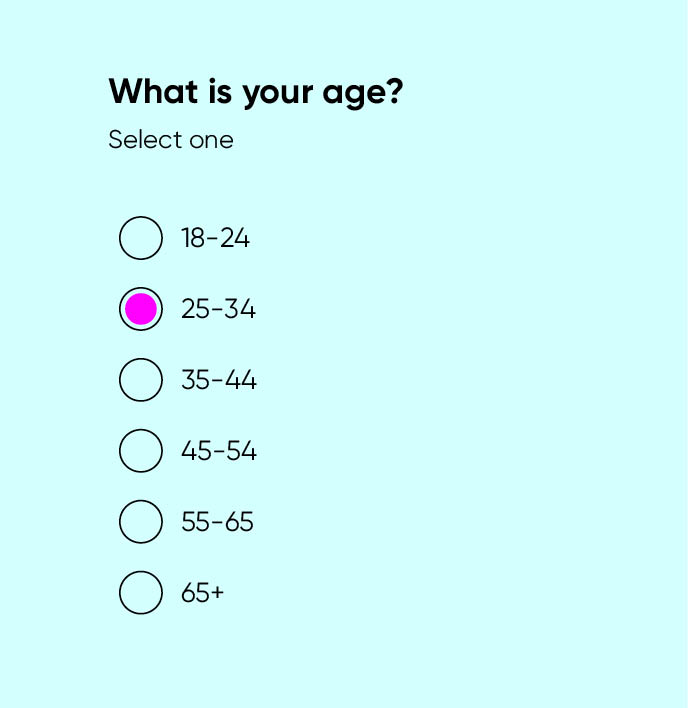
Dynamic is a word we use often in marketing and business—it signifies change, activity and progress. In the market research world, dynamic questions and elements push progress by providing a graphical and interactive way for researchers to capture respondent data in online surveys. Instead of using standard HTML inputs, such as traditional radio buttons or select boxes (Figure 1), a dynamic question typically relies on Javascript or HTML5 to enable flexible and customized design elements.
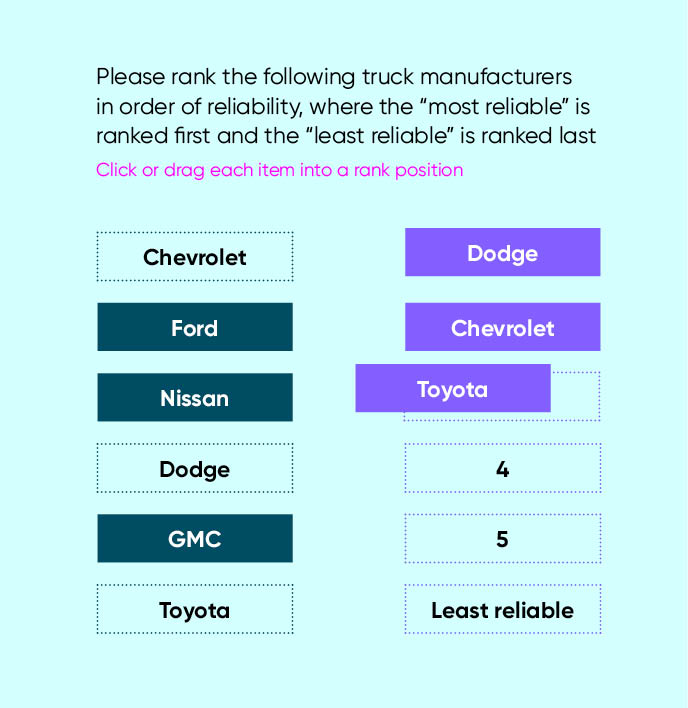
With technological advances across the board, most people expect and feel entitled to access to the latest new thing. The research respondent reflects these expectations and dynamic questions help to address their need for responsivity and more advanced functionality. Dynamic elements allow users to manipulate objects across the screen. Drag and drop as well as slider input is possible (Figure 2). Use of a virtual shelf, which allows respondents to scroll through a graphical representation of products, or a 3D rotation of an image are other examples of dynamic elements.
How can dynamic questions help us?
Enhanced usability
Dynamic questions allow researchers to capture information from respondents in new ways. For example, a virtual shelf can attempt to simulate a real-world shopping experience and the respondent can indicate product preference by putting items in a shopping cart. Using a drag and drop interface, respondents can physically rank order a set of cards rather than typing in a rank number in a text box. In both of these instances, we are attempting to establish an intuitive and user-friendly way for survey respondents to express their opinions about a brand or product.
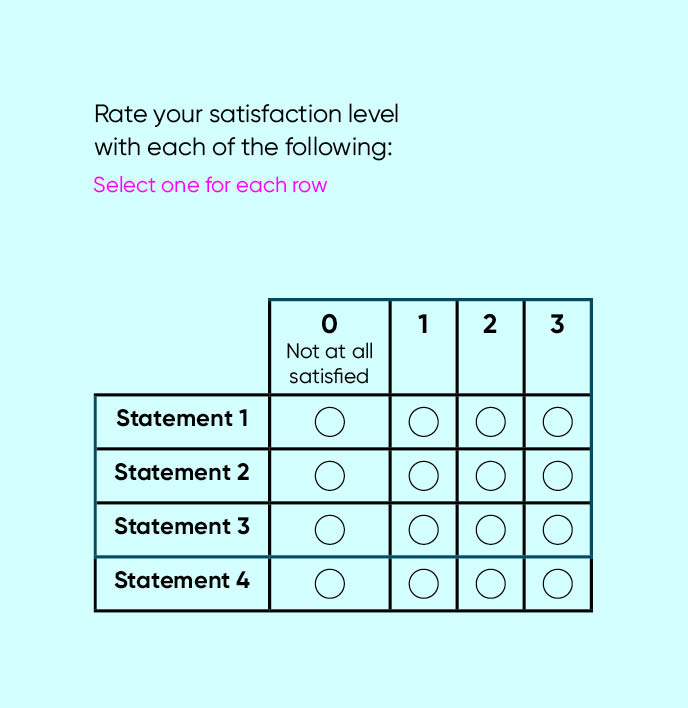
This approach also enables enhanced and flexible design capabilities to create question types that are suitable for different platforms. With the number of individuals using mobile platforms to respond to survey outreach, this point is critical for small screens with touch functionality. A traditional grid, especially in the case where a lot of text or columns are in use, is not mobile friendly (Figure 3). Input areas are too small, and the row text wraps. In previous studies encompassing 74 million survey starts, we discovered that this is one sticking point that will lead respondents to abandon the survey.
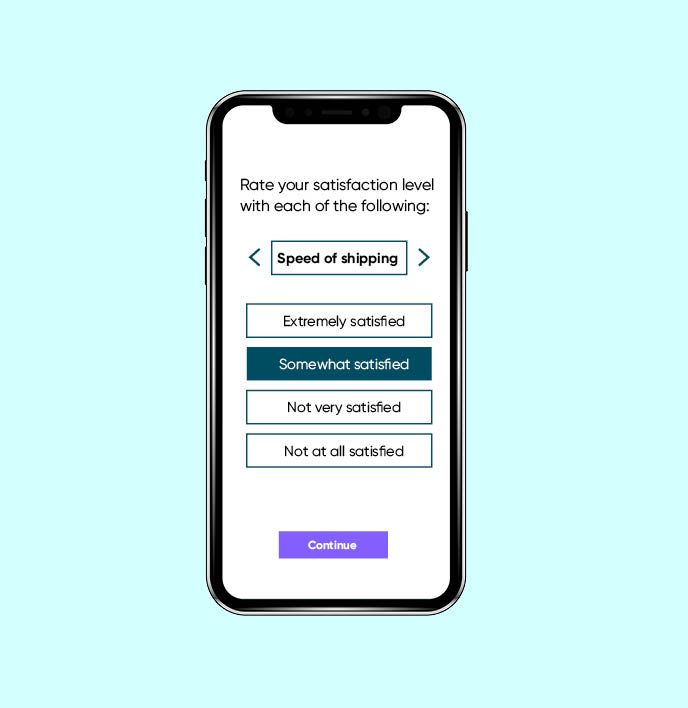
A dynamic question can be a suitable alternative for improving respondent retention. In card sort, statements are shown one at a time (Figure 4). When a selection is made, the next statement slides across the screen. This format allows us to expand the size of the text and input areas suitable for smartphone users. Such changes will increase survey participation among the mobile population.
Improving respondent engagement
With attention spans of the average consumer dropping to mere seconds (below that of a goldfish, according to a recent study by Microsoft), the online survey experience must be engaging. With dynamic questions, respondents see a more compelling graphical interface to interact with and inputs are not just limited to point and click tasks.
Studies have shown that dynamic questions can really work to engage respondents. They report a more “fun” and “interesting” experience than with traditional surveys. However, other researchers have found increasing dropout rates, reduced tendency to read questions, and even respondent confusion.
Much of the discrepancy here centers around good design. Javascript and HTML5 give almost unlimited capabilities for customizing and even creating new question formats, not all of these are well executed or familiar to respondents. Evidence also shows that dynamic questions take more time. This can be a good thing if it reflects deeper respondent engagement; a bad thing if it reflects user difficulties.
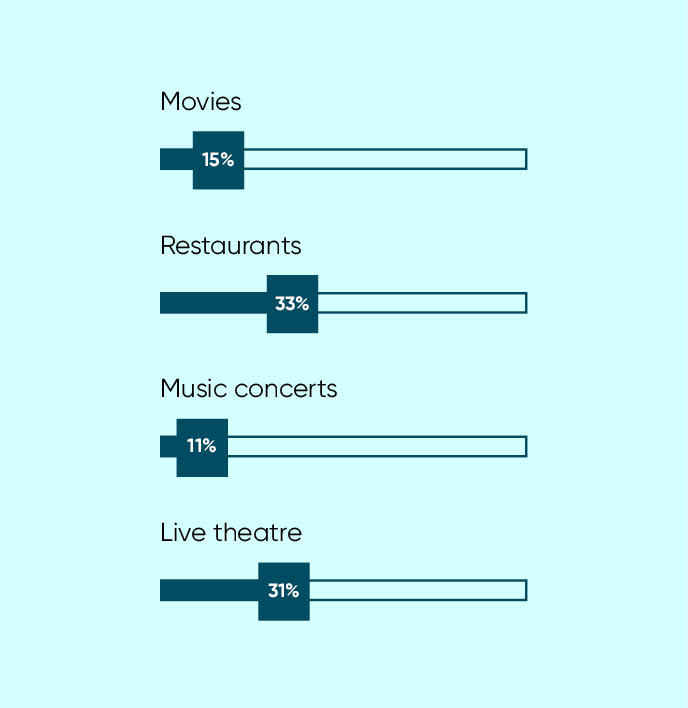
Dynamic questions may require an additional layer of cognitive processing that involves hand-eye coordination and manipulation with the computer mouse (PC) or touch input (for a mobile device). In some instances, objects must be manipulated on the screen and not all segments of the population (e.g. the elderly) are suited for this. A poorly designed dynamic question may be confusing, causing respondents to focus more attention on the physical act of completing the task at hand rather than thinking about the question asked by the researcher.
In one such case, a usability issue arose with a constant sum slider (Figure 5). It included 15 rows, so many of the items appeared below the fold and the user was unable to see the calculated sum at the bottom. This led to respondent frustration and a dramatic increase in survey drop-out.
Pre-testing is thus critical when using custom and dynamic forms that stray away from standard question structures. Good design also requires specialized expertise. While many market researchers may direct hired programmers on how they want their dynamic questions customized or setup, this task is better done in collaboration with a visual designer or usability specialist.
Improved data quality
The ultimate goal of any new research methodology is to improve data quality, delivering results that can be used to make informed business decisions. Using a dynamic question to improve survey usability means reducing the cognitive burden on the respondent. Cognitive burden refers to the amount of thinking or effort required by the respondent, and reducing this has shown to have a positive impact on data quality and accuracy.
Using the previous example of a rank sort question with a drag and drop interface (compared to numeric text input), we’d predict that a dynamic rank sort would provide a more natural interface resulting in better feedback and visual cues for usage. So that when the respondent makes their choices, they can easily double check that the rank order they’ve chosen conforms to their actual opinions or make modifications if it does not.
Dynamic questions can also serve the purpose of capturing information that we could not otherwise with a standard question type. For instance, the use of the slider in scale response questions can carry unique data benefits. Respondents can more distinctly define where they fall on a likeability scale instead of confining their responses to pre-set categories.
As mentioned, a downside to dynamic questions are the limitless ways they can be customized, and some designs lead to unintended consequences. We have seen data bias occur with extreme use of colors. Colors are sometimes used to denote different parts of a rating scale (red for the negative end/green for the positive). In one study, this created a bias away from the negative end of the scale. We hypothesized that the color used was a strong red that may have appeared very aggressive to respondents (Figure 6). Colors that are out of place can also attract attention to one part of the scale, increasing bias for that choice (Figure 7).

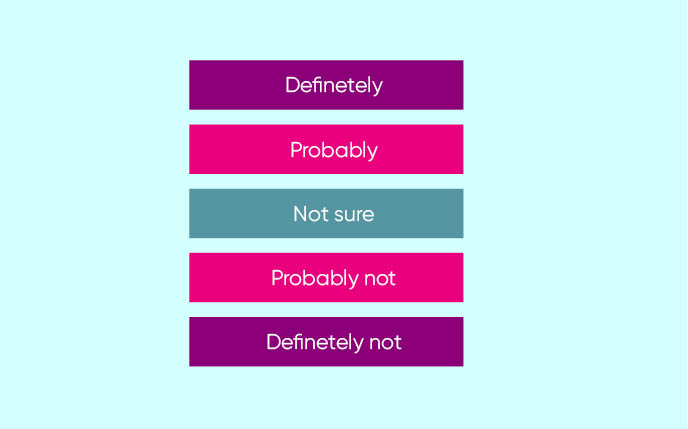
Data showed a bias for the middle part of the scale (“Not sure”)
In many cases, however, we simply note a change in the data when moving from a standard question type to dynamic ones. It isn’t always apparent which data collection method yields the more correct responses, only that they are different.
Data changes should surprise us: when the fundamental nature of the input method and arrangement of the question changes, so will the distribution of the data. Employing a drag and drop interface instead of single select radio button format will cause variability in the data. One is a point-and-click exercise, the other involves moving a virtual object.
Guidelines for using dynamic questions
There’s no question that dynamic questions offer unique opportunities for engaging today’s consumers. However, executed or used without proper consideration can result in a poor design that causes user frustration, respondent dropout or data bias.
Points to consider
Are the dynamic features offering a benefit over a traditional method?
A dynamic question without a clear advantage or purpose should be closely examined. In many cases, a standard question type can serve the same function while being a familiar format that has stood the test of time among respondents.
A dynamic question can provide a mobile-friendly format and increase survey participation among smartphone users. A rank order question that uses a drag and drop method offers a usability enhancement over numeric text input. It helps to facilitate a respondent’s answer. A virtual magazine or clickable ad test are unique ways to gather respondent feedback that can’t be done using traditional means. There is a clear benefit and purpose for all of these.
A dynamic question can involve extra physical steps to complete when compared to a standard HTML input question. For example, extra clicks, additional mouse movement, or dragging and physically manipulating objects across the screen. Is that necessary? Make sure there is a benefit to having respondents spend this extra time.
How well does it render across devices?
Respondents can access surveys from a variety of devices and platforms. Does the dynamic question function and render properly across all screen sizes? What may work well for a PC device may not be very usable on a mobile phone.
Is it immediately apparent what to do and how to answer the question? The respondent may be encountering a new question format for the first time. Any task that requires reading instructions or additional learning places extra demand on respondents. Ideally, it should be immediately apparent how to interact with the dynamic question. Don’t rely on respondents to read instructions. Pre-testing is a good way to ensure good survey design.
How will you be using the data?
Data collected by using dynamic question may not be directly comparable to data collected using traditional formats. Any comparisons with previous norms should be done with careful consideration. When employing dynamic questions, develop standards and maintain consistency in how you customize them. That way you can properly interpret the relative value of your data without worrying that the question format is biasing results.
Dynamic questions can improve the survey experience, but there can be pitfalls to avoid. Market researchers should not use this approach simply as a way to “jazz up” a questionnaire as this can lead to a survey with more style than substance, as well as unintended data biases. But dynamic questions hold great promise in two key areas: allowing flexibility for designers to meet the needs of the cross-platform respondent and offering additional functionality for surveys to capture information in ways that are not possible in a traditional format
Related resources
The complete guide to market research software
The complete guide to market research software The complete guide to market research software The landscape for market research and analytics software The market research software landscape can be daunting. Insight Platforms hosts the industry’s largest directory of research software tools, and it is far from complete. More than 1,700 solutions are listed in nearly […]

Adapt to thrive: Innovation, AI and speed to insight
Adapt to thrive: Innovation, AI and speed to insight Adapt to thrive: Innovation, AI and speed to insight Market research has long been seen as a slow-moving industry, often hesitant to embrace new technologies and methodologies. Being forced to give up in-person research methods accelerated the adoption of digital-first ways of working, AI-driven insights, and […]

The digital leader’s guide to CX
The digital leader’s guide to CX: An omnichannel strategy for better business outcomes The digital leader’s guide to CX: An omnichannel strategy for better business outcomes Seamless, Smart, Scalable CX for leaders The future of digital customer experience is here—and it’s more connected, intelligent, and actionable than ever. Digital leaders know the challenge all too […]

Learn more about our industry leading platform
FORSTA NEWSLETTER
Get industry insights that matter,
delivered direct to your inbox
We collect this information to send you free content, offers, and product updates. Visit our recently updated privacy policy for details on how we protect and manage your submitted data.