EXPLORATORY ANALYSIS
The truth is in there. And you’ve got the tools to find it.
Delve into your data. Our powerful analysis tools make complex questions easy to ask and answer.

How Forsta helps you
analyze your data
Analyze and visualize all in one place
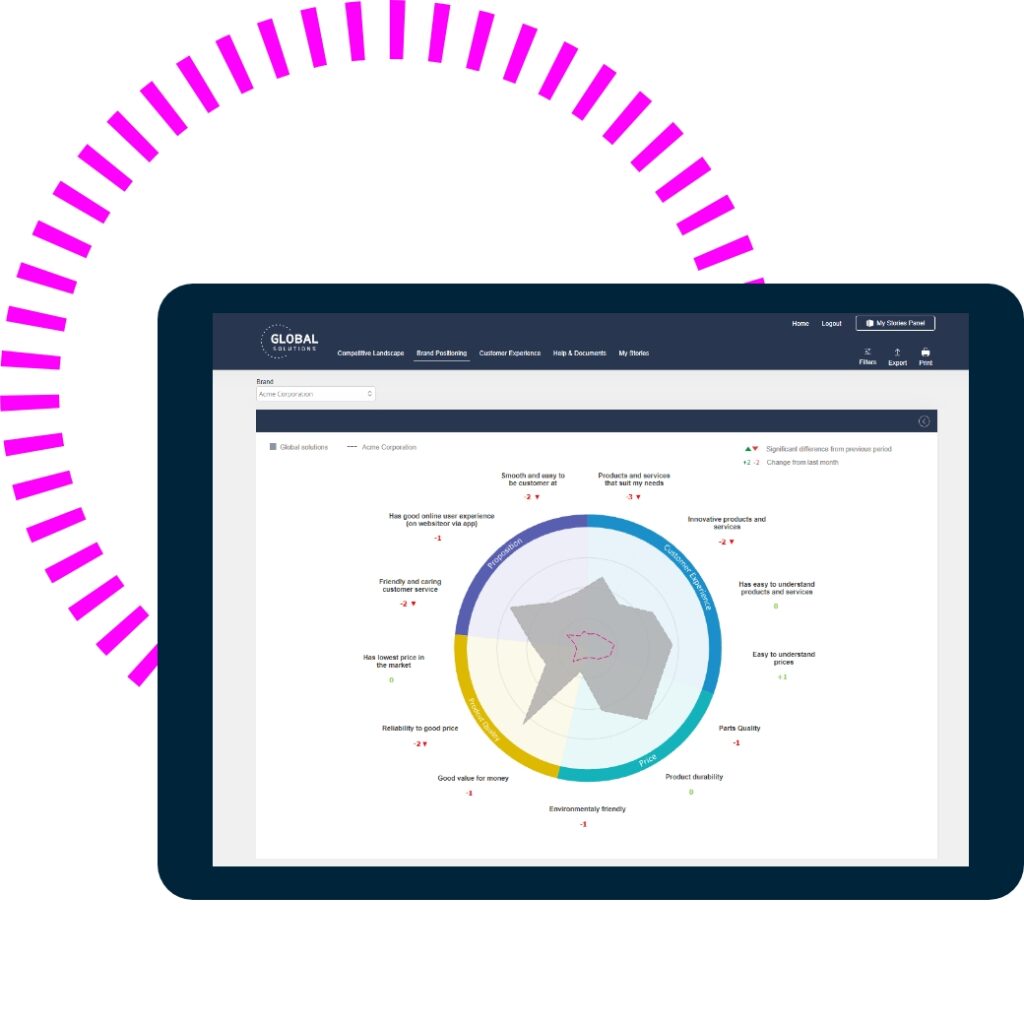
Sure, you can jump from app to app, carting in data and clocking up errors every time. Or you can do it all in one place – with a platform that lets you analyze on the fly and watch reports and infographics update themselves live, for visual answers to your burning questions.
Go free-diving into your data
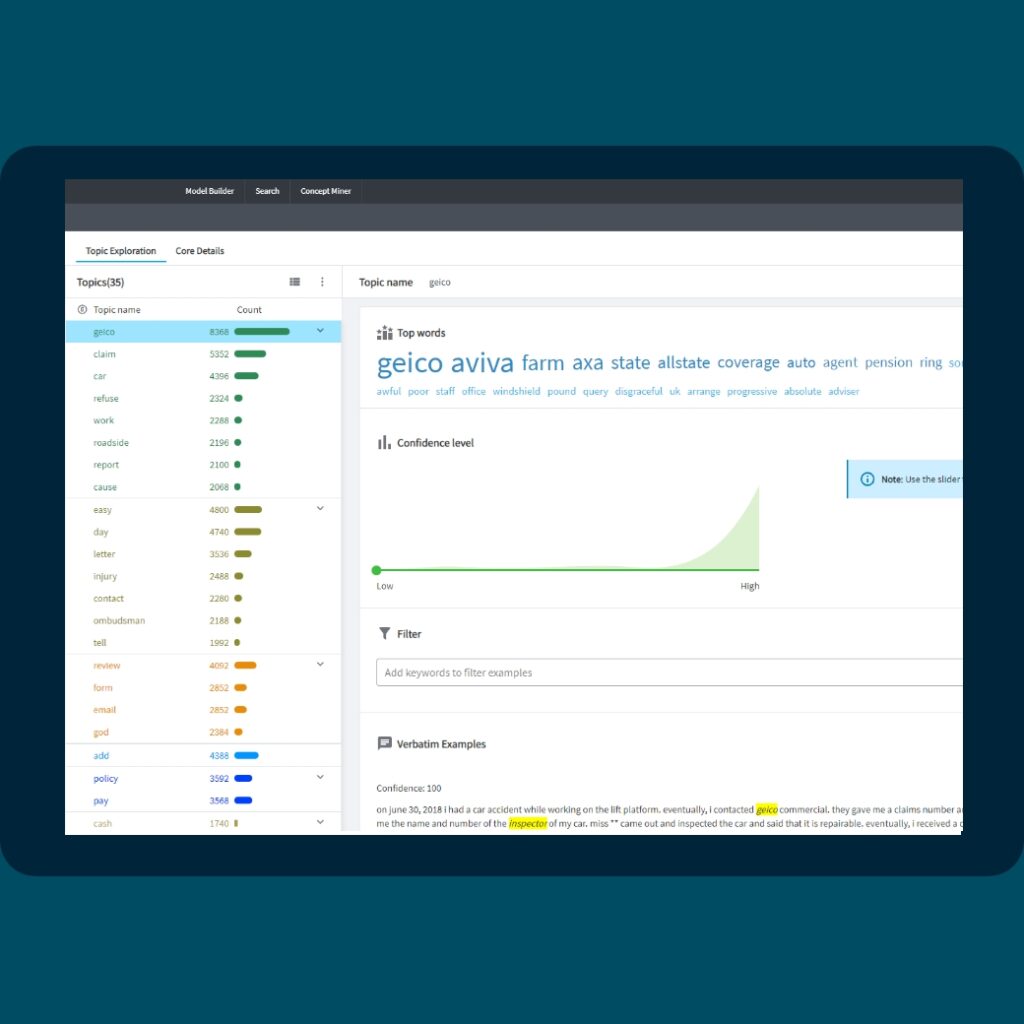
Whether you’re a newbie looking for quick graphic answers or a pro who wants to get up close and personal with tables and charts, we give you the right toolkit to explore your data solo.
Save time doing it
Built-in automation kicks analysis into high gear. Let our platform do basic analytic tasks for you, and set presets for things like weighting, so you don’t waste time repeating yourself.
COMPLEX WEIGHTING
Redress the balance
Use sophisticated weighting to even out gaps in your research responses, so you can analyze knowing your data’s rock-solid. Whether it’s a simple fix or a complicated blend, Forsta can handle as many traits as you can throw at it, all at the same time.


BENCHMARKING
Pit past against present
Set part performance as your yardstick and use dynamic filters to measure different parts of your data against it. See losses, gains, what’s stayed the same and where things have changed.
COMPLETE TOOLKIT
Analysis that’s open to all
Let anyone talk to your data with tools that each user can tailor. Seasoned explorers have free rein to delve into their data. Or you can tweak the toolkit for less experienced users to explore, play, and test things out, without needing to dig down into detail.
