Using online surveys to evaluate and monitor your business performance

Every successful business must have a concrete and measurable way to evaluate performance; monitor their strength and weaknesses, and keep a pulse on the customers experience as well as the competitive landscape. One way to do this is through a powerful online survey technique called, “tracking.”
In a tracking survey, customer feedback on the same set of metrics is collected at regular intervals. Tracking metrics may include brand awareness, customer satisfaction / loyalty, or even customer attitudes towards your (or a competitor’s) product. Regular feedback from surveys establishes KPIs for benchmarking your performance, and keeps tabs on competitive dynamics.
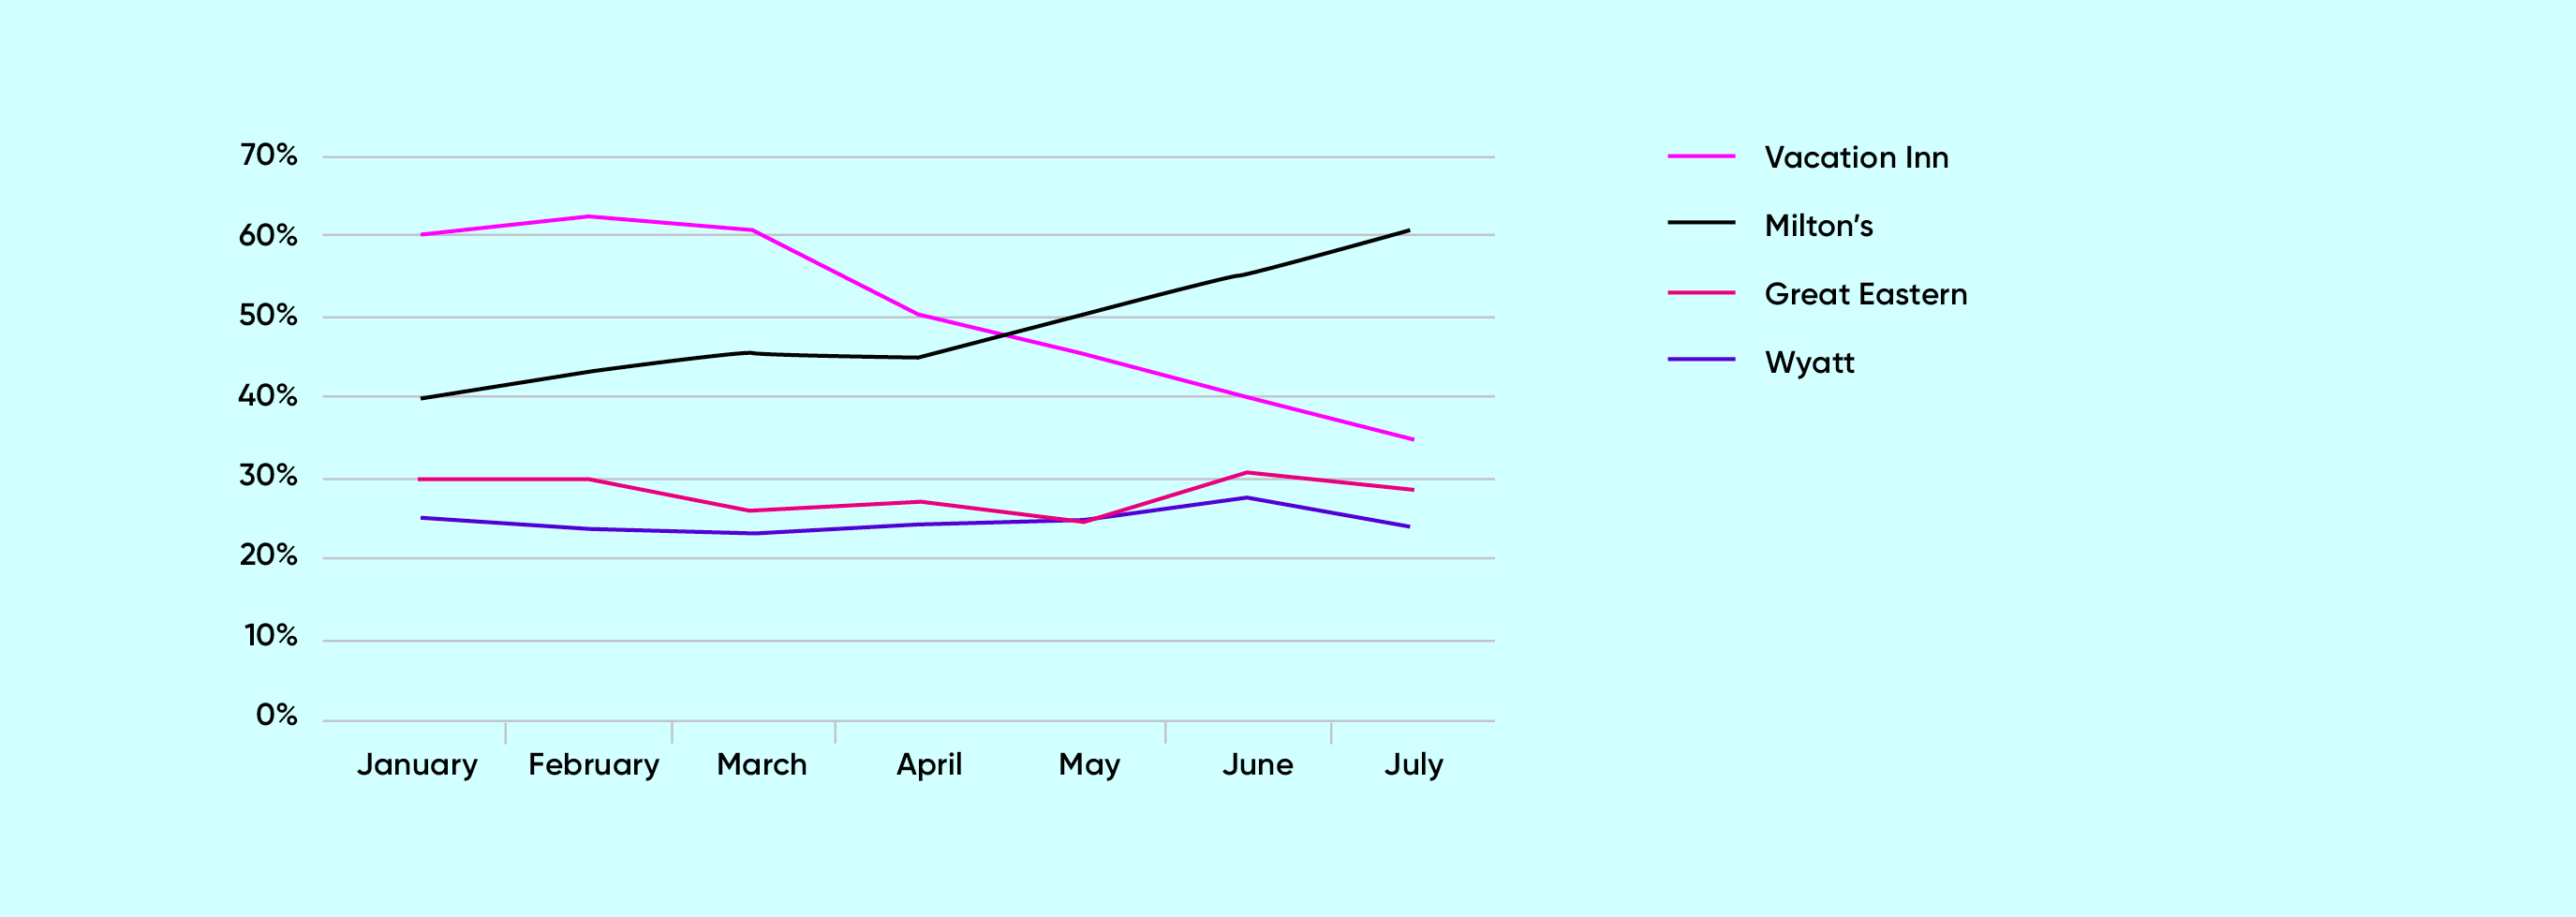
Here’s an example. Figure 1 reports the results of a monthly tracking survey that asks for respondent awareness of hotel brands. Brand Awareness is a leading KPI for generating business and customer leads. Starting in May, Milton’s brand awareness began to show significant growth at the expense of Vacation Inn. This awareness growth may have coincided with a new marketing campaign or a change in business direction. Whatever the case, tracking this KPI helps Milton’s to assess that their work or marketing efforts are achieving the desired outcome within the competitive landscape. For Vacation Inn, the tracking research indicates the need to make specific strategic and tactical adjustments to counter Milton’s growing advantage.

Keys to a successful tracking study
When running any tracking program, it helps to consider a few key points for success.
What are your KPIs?
In general, KPIs are indicators or drivers of business success. They serve as a benchmark for performance and can help you understand where tactical adjustments may be needed. In survey research, KPIs (the tracking metrics) are commonly either brand or customer experience related. As in the above example, ‘Brand Awareness’ is an important KPI to measure a person’s first step toward developing a relationship to a brand. NPS (Net Promoter Score) or customer satisfaction is another well-used KPI in tracking research used to gauge customer loyalty and retention.
Tracking these metrics over time allows you to spot trends and see growth or declines. Specific business or marketing events and even outside current events will impact your KPIs, so tracking them will help you assess the overall performance. Figure 2 illustrates how tracking data is reported over time. Commonplace is to look at trend lines or bar charts which shows the data captured at regular intervals. Using ‘wave 1’ or ‘Q1’ as our benchmark, we can say Milton’s has made significant improvement in brand preference.

How often should you sample?
A key consideration for any tracking study is how often to survey, and whether to be in field continuously or periodically. This should be determined by your budget and research needs. In continuous tracking, respondents are sampled on a daily basis. Continuous tracking is relevant for larger firms where the researcher must have the flexibility to evaluate survey metrics at literally any point in time throughout the year. Firms like AT&T or Geico have tremendous advertising budgets with marketing events or campaigns taking place on a daily basis and in different parts of the country. In order to monitor the performance on each of these events, a daily tracking tool is needed. A continuous tracker would also be appropriate when dealing with a large volume of customer transactions. A survey instrument can capture performance metrics of each transaction in real time.
Periodic or wave tracking, on the other hand, involves sampling consumers at various intervals. For example, quarterly, biannually, or annually. Budget or operational constraints may limit how often the researcher can field interviews. Also, for most business, changing customer perceptions or awareness levels takes time, so quarterly tracking of these metrics is a more sensible approach.
When using periodic tracking it’s important to keep in mind the timing of specific business or marketing events and field your survey accordingly. In order to gauge the impact of these events, data collection needs to occur shortly before the event takes place. This serves as a benchmark or baseline. Then another measurement would take place after the event. Timing field this way provides the ‘pre’ event and ‘post’ event comparison of the survey data. Then, the researcher can assess whether KPI improvements or declines have occurred.
Who should you sample?
You want to sample your target audience, whether that be video gamers, expectant mothers or finance professionals. Only your existing customers or potential ones that you are targeting strategically (or in your campaigns) should be important to you. These are the people you want to survey. One key difference between tracking studies and other types of survey research is that tracking studies repeatedly target the same sample frame over long periods of time. Thus potentially you may draw the same person to the same survey multiple times. This may or may not be desired. In a customer satisfaction tracker, a person that repeatedly makes a transaction with your business will receive a survey on each transaction. For a B2B brand awareness study, on the other hand, duplicated sample should be spaced out. A six-month interval is ideal before reusing sample. But a three-month interval is common.
Which restaurant do you most prefer?


Maintain consistency
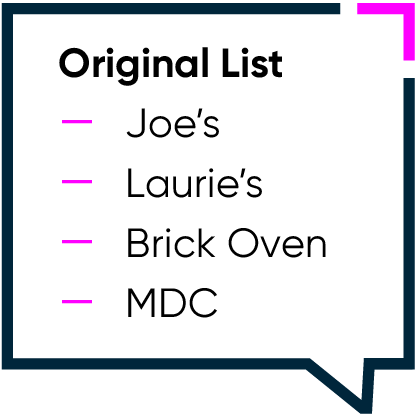
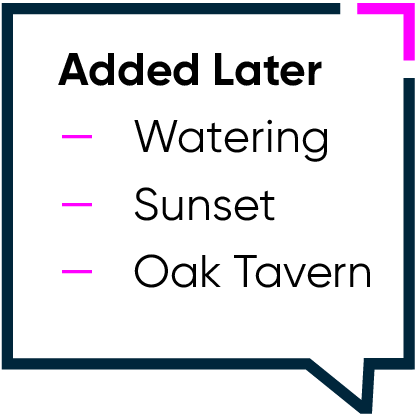
Fielding consistency is key to a successful tracking study. When beginning a tracking program, proper preparation and buy-in from stakeholders is especially important as later changes can compromise your ability to derive the insights you need. A tracking study measures the same metric at regular intervals. In order to chart trend lines or make historical comparisons with your data, data collection procedures must stay consistent. This will ensure that any movement in the data reflects an actual change, not a change in the data collection process. Changing sample providers or the sample frame can impact tracking data. Revising question text, question order or editing answer option lists may do so as well. In Figure 3, additional soft drink brands are added as answer options to the brand preference question. This will have the effect of decreasing the scores for the four original brands as some preference share shifts to the new brands.
Conclusion
Tracking can be a powerful way for business and marketing professionals to evaluate and drive company or team performance. By collecting consumer feedback regularly and often you keep a constant pulse on customer perceptions and where you stand.
It’s important for business to innovate and evolve, and as change happens, tracking allows you to measure your success and failures each step of the way.
Related resources
Integration: the new frontier of insights for research HX
Integration: the new frontier of insights for research HX Webinar synopsis: Discover the faster, smarter and more accurate way to research with Research HX. Gone are the days of sequential processes skipping between platforms. Parallel workflows, integrated steps and AI enhancements to the tools you use daily. Related resources

AI and the new era of customer experience: Insights for 2025 and beyond
AI and the new era of customer experience: Insights for 2025 and beyond Webinar synopsis: In today’s fast-paced digital landscape, customer experience (CX) is the ultimate differentiator—and AI is rewriting the playbook for how businesses connect with their customers. Tune in to an engaging session that blends cutting-edge thought leadership with actionable strategies to elevate […]

The complete guide to market research software
The complete guide to market research software The complete guide to market research software The landscape for market research and analytics software The market research software landscape can be daunting. Insight Platforms hosts the industry’s largest directory of research software tools, and it is far from complete. More than 1,700 solutions are listed in nearly […]

Learn more about our industry leading platform
FORSTA NEWSLETTER
Get industry insights that matter,
delivered direct to your inbox
We collect this information to send you free content, offers, and product updates. Visit our recently updated privacy policy for details on how we protect and manage your submitted data.